
Luxury market headlines can be misleading if you read them at face value. A report might say inventory is tight, contracts are rising, or discounts are widening, but none of that tells you much until you know which price band, which borough, and which methodology is being used. If you want to understand New York’s high-end market the way a developer would, you need to look past the headline numbers and focus on how supply, demand, pricing, and concessions work together. Let’s dive in.
Define luxury the same way every time
The first rule is simple: do not mix definitions of luxury without noting the difference. In Miller Samuel’s Q4 2025 closed-sales reports, Manhattan’s luxury threshold was $4.2 million, while Brooklyn’s was $2.425 million. The luxury median sales prices were $6.038 million in Manhattan and $3.1 million in Brooklyn, which shows how different the top tier can look across boroughs, according to the Miller Samuel Q4 2025 market data.
That matters because other reports use a different lens. StreetEasy’s January 2026 sales report tracks contracts rather than closed sales, and it defines Manhattan’s most expensive third as starting at $2.475 million and the most expensive 10% at $6.995 million. Those figures are useful, but they are not directly comparable to a closed-sales luxury threshold.
If you are reviewing market data before listing, buying, or launching a property, consistency matters more than the headline. A clean analysis starts with one framework, then stays inside it long enough to draw real conclusions.
Use Queens as context, not a luxury benchmark
In this regional picture, Queens works best as a pricing and activity comparator rather than a top-end benchmark. StreetEasy reported that 289 homes entered contract in Queens in January 2026, up 4.3% year over year, with a median asking price of $678,000, based on its January 2026 sales report.
That does not make Queens less important. It simply means that if you are reading luxury data in Manhattan or Brooklyn, Queens helps you understand the wider market backdrop rather than define the upper tier itself.
Read months of supply as market pace
A developer rarely asks only, “How many listings are there?” The better question is, “How quickly can this inventory clear at this price level?” That is where months of supply becomes so useful.
In Q4 2025, Manhattan luxury ended the quarter with 12.3 months of supply, 1,090 listings, 266 closed sales, 105 days on market, and a 6.4% listing discount, according to Miller Samuel’s luxury matrix. Brooklyn luxury looked very different, with 3.2 months of supply, 252 listings, 238 closed sales, 58 days on market, and a 1.9% listing discount.
That gap tells you a lot. Manhattan luxury was moving at roughly 8.1% monthly absorption, while Brooklyn luxury was closer to 31.3%. So even if Manhattan had significant high-end inventory, that did not mean it was clearing quickly.
Low inventory does not always mean speed
This is one of the biggest mistakes people make in the luxury market. They see a limited number of listings and assume buyers need to move fast at any price.
But the data shows the opposite can happen. Manhattan luxury still had a long 12.3-month clearing window, even with a defined luxury inventory pool. Brooklyn luxury, with fewer listings overall, moved much faster.
For broader context, Manhattan overall had 6.7 months of supply in Q4 2025, while Brooklyn overall had 3.4 months of supply, based on the same Q4 2025 Miller Samuel reports. So Manhattan luxury was moving more slowly than its broader market, while Brooklyn luxury was moving at almost the same pace as Brooklyn overall.
Watch the price bands inside Manhattan
Looking at Manhattan as one market can flatten the story too much. Price-band data gives you a much clearer read on where demand is flowing and where inventory is lingering.
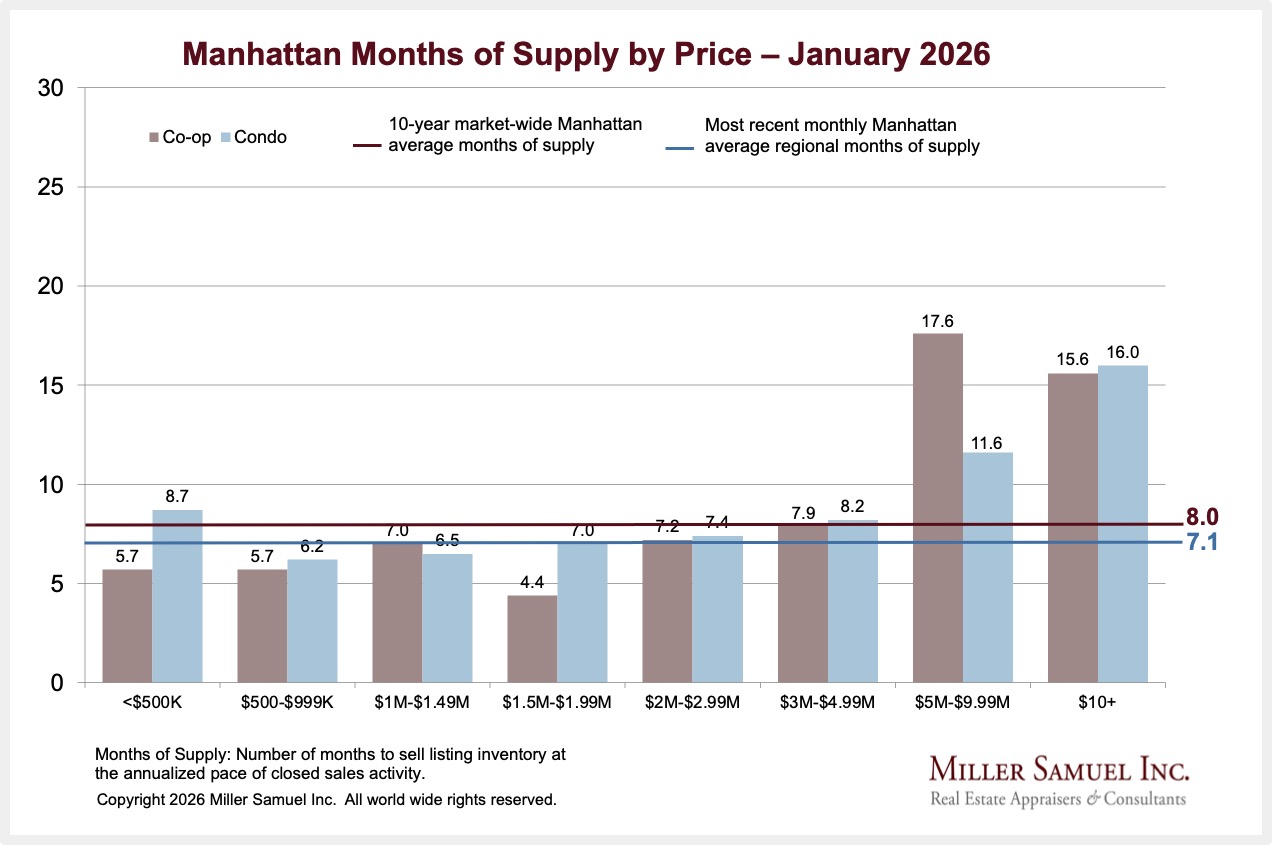
According to the January 2026 Manhattan months-of-supply chart, supply ranged from 4.4 months for $1.5 million to $1.99 million co-ops to 17.6 months for $5 million to $9.99 million co-ops. In condos, the $5 million to $9.99 million band carried 11.6 months of supply, while $10 million-plus condos and co-ops were at about 16 months.
That chart also shows a 10-year Manhattan average of 8.0 months and a recent regional average of 7.1 months. In other words, not every luxury property is competing in the same market. Once you move into the $5 million-plus range, the clearing window often stretches well beyond the average.
Track contracts, not just closed sales
Closed sales tell you what has already happened. Contracts give you a more current read on buyer intent. In a market that changes quickly by price band, both matter.
Manhattan’s January 2026 signed-contract report showed 302 condo contracts in total. Of those, 35 were in the $5 million to $9.99 million band, 13 were in the $10 million to $19.99 million band, and 4 were above $20 million.
Brooklyn’s condo report was much thinner at the top. It showed 117 total contracts, but only 3 in the $4 million to $4.99 million band and 1 in the $5 million to $9.99 million band. That is a useful reminder that Brooklyn can be very healthy in the upper-mid market without having the same ultra-luxury depth as Manhattan.
Headline contract growth can hide important details
StreetEasy reported that Manhattan had 733 new contracts in January 2026, up 5.6% year over year, based on its monthly sales report. Inside that number, the most expensive third posted 196 new contracts, up 29%, while the most expensive 10% reached 38 new contracts, up 18.8%.
That is a stronger signal than the headline alone. It suggests upper-tier Manhattan demand improved meaningfully on the contract side, even as months of supply remained elevated in many luxury bands.
Brooklyn’s picture was different. It posted 353 homes entering contract, down 12% year over year, yet 60.2% of Brooklyn condo contracts were above $1 million. That points to healthy demand in the upper-middle portion of the market, even if the ultra-luxury pool remains narrow.
Use discounts and concessions as signals
Price cuts are only part of the story. In higher-end deals, the negotiation may happen through seller concessions that never show up clearly in list-price data.
StreetEasy’s concessions analysis notes that concessions may include transfer-fee coverage, inspection fees, closing credits, or rate buydowns. It also points out that public listings likely undercount actual concessions because some are negotiated privately.
That is why discounts should be read alongside pace. In Q4 2025, Manhattan luxury showed a 6.4% listing discount, while Brooklyn luxury was at 1.9%. Brooklyn new-development condos showed a 1.6% discount, according to the Miller Samuel quarterly report.
When supply is long, contracts are softer, and concessions are rising, the market may be using incentives to move inventory instead of resolving value through clean price discovery. That distinction matters if you are setting an asking price, evaluating an offer, or planning a launch.
What this means for sellers
If you are selling in Manhattan’s higher luxury bands, pricing discipline matters. A small overreach can push your property into a much longer marketing window, especially in segments where months of supply runs well above the market average.
That does not always mean cutting aggressively. It means placing your home in the correct competitive band, understanding the likely absorption window, and deciding whether presentation, timing, or incentives will do more than a simple price adjustment.
In Brooklyn, the conversation can be different. Luxury supply has been clearing faster, so the right strategy may focus more on sharp positioning and efficient execution than on extended negotiation room.
What this means for buyers
If you are buying, this framework can help you avoid broad assumptions. A Manhattan luxury buyer and a Brooklyn luxury buyer are not negotiating in the same environment.
In Manhattan, elevated supply in the upper bands may create more room to negotiate on price, timing, or concessions. In Brooklyn, where luxury supply moved more quickly in Q4 2025, buyers may need to act with more precision when a well-positioned property comes to market.
What this means for launches and new development
For developers and sellers bringing a property to market, the key question is not just whether demand exists. It is whether your product is entering a fast-clearing band or a slow-clearing one.
That distinction is especially important in new development. In Q4 2025, Manhattan’s luxury market sold 266 units, while Manhattan new-development condos posted a $2.285 million median sales price, with sales up 12.6% year over year as inventory fell 13.3%, according to Miller Samuel’s quarterly report. Brooklyn new-development condos sold 206 units, with a $1.2375 million median price, 5.8 months of supply, and 29.7% of all condo sales.
Those differences support borough-specific launch strategy. Pricing, incentive structure, and timing should reflect the actual band a project will compete in, not a broad idea of what “luxury” means.
Why developer-style reading matters
When you read the market like a developer, you stop asking whether New York luxury is up or down in general. Instead, you ask better questions.
What is the right threshold for this property? How quickly is this exact band clearing? Are contracts rising where this home competes? Are discounts telling you about weakness, or are concessions doing the real work behind the scenes?
That is the kind of analysis that leads to stronger decisions. If you want tailored guidance on how your property or search fits into today’s New York market, the Thurber Team can help you translate the data into a smart next move.
FAQs
How is luxury real estate defined in Manhattan and Brooklyn?
- In Miller Samuel’s Q4 2025 closed-sales reports, luxury started at $4.2 million in Manhattan and $2.425 million in Brooklyn, but other reports may use different contract-based definitions.
What does months of supply mean in New York luxury real estate?
- Months of supply shows how long it would take to clear current inventory at the current sales pace, which helps you gauge whether a price band is moving quickly or slowly.
Why is Manhattan luxury moving differently than Brooklyn luxury?
- Q4 2025 data showed Manhattan luxury at 12.3 months of supply versus 3.2 months in Brooklyn luxury, which suggests much slower clearing at the top end in Manhattan.
What do concessions tell you in New York luxury deals?
- Concessions can signal negotiation leverage and may include closing credits, transfer-fee coverage, inspection fees, or rate buydowns that do not always appear as visible price cuts.
How should sellers use New York luxury market data before listing?
- Sellers should place their property in the correct price band, study the likely absorption window, and decide whether pricing, timing, presentation, or incentives need to change before launch.